
One set of numbers everyone trusts — from board packet to finance reconciliation.
Civic Mesa Reporting & Analytics is a complete reporting product your office can run on its own: cross-module KPIs, at-a-glance gauges, year-over-year trends, and twelve-month volumes on one dashboard, current as of your last action. Every figure exports to the exact row it came from, so the number on screen, in the export, and in the meeting all match. Acquire it by itself — or turn it on beside the rest of the Civic Mesa suite. Either way, it's built to be the best product in its category.
One set of numbers everyone trusts.
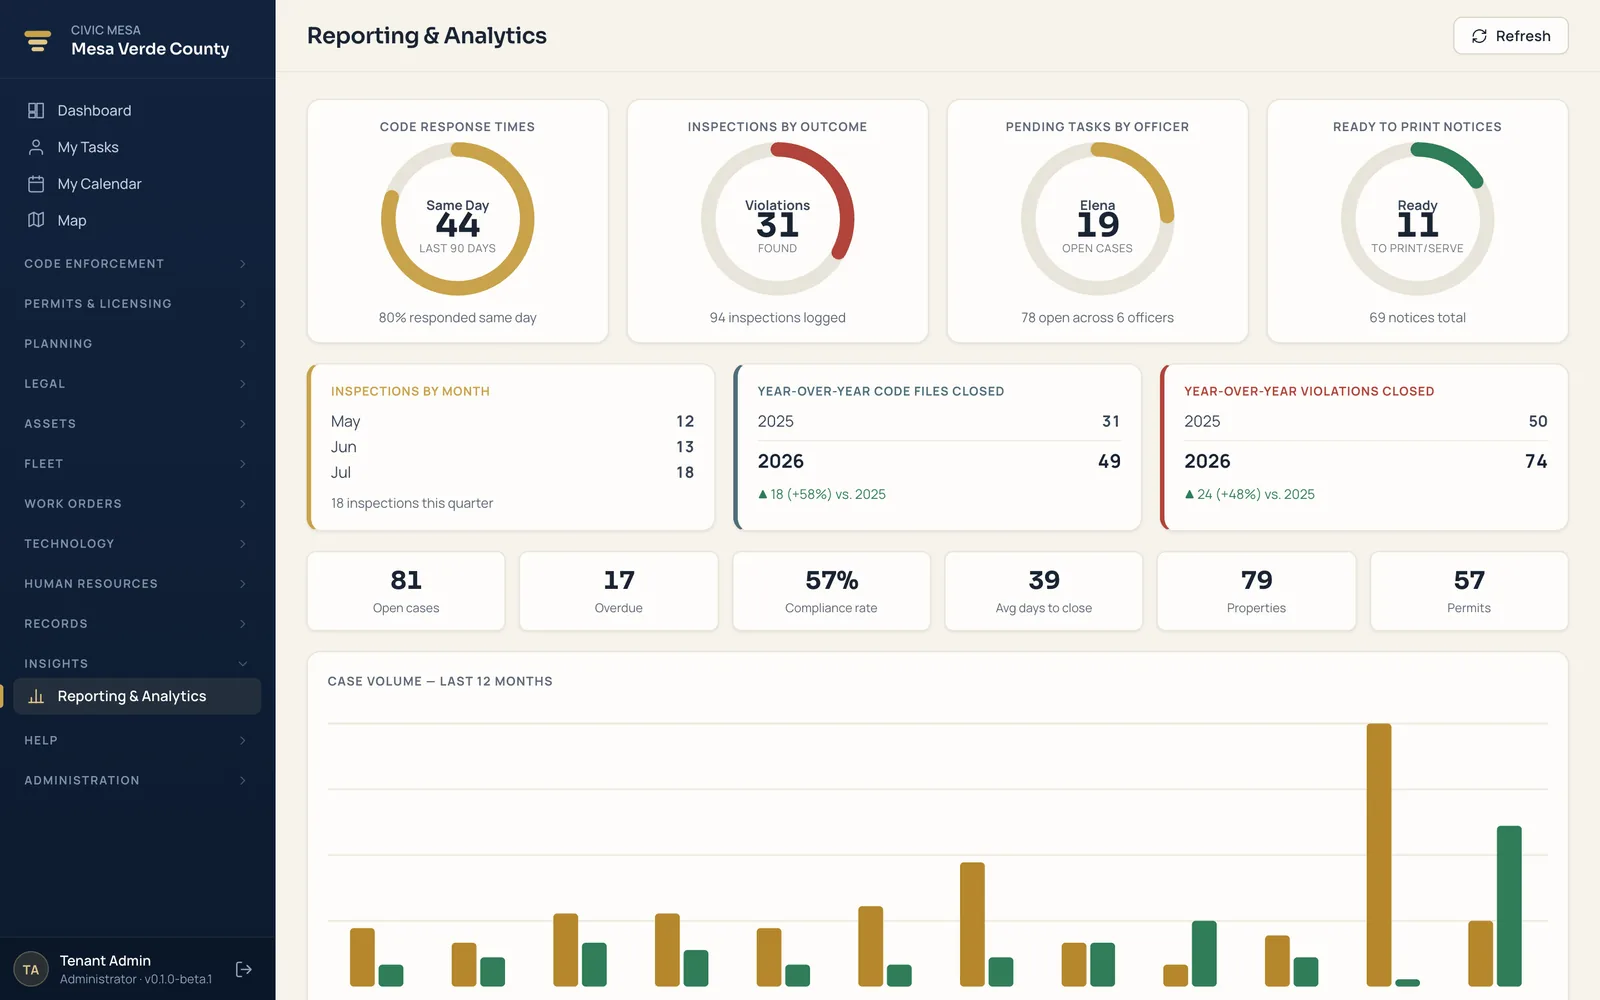
Dashboards that read across every module you've turned on — from one data core, not five disconnected reports. Backlog, cycle time, fee revenue, and inspections due sit side by side, current as of your last action, and every figure exports to the row it came from.
- Cross-module KPIs
Backlog, cycle time, compliance rate, fee revenue, and inspections due — read across every module you've enabled, on shared data.
- At-a-glance gauges
Response time, inspections by outcome, workload by officer, and notices ready to print and serve — the day's picture in a screen.
- Year-over-year trends
Cases and violations closed this year against last, with the deltas and percentages computed for you.
- Twelve-month volumes
Opened versus closed by month, so you can see where work is piling up before the board asks.
- CSV exports
Pull the rows behind any number for a board packet, a finance reconciliation, or a records request.
- One source of truth
The figure on screen, in the export, and in the meeting all match — because they come from the same record.
Walk in and know exactly where things stand.
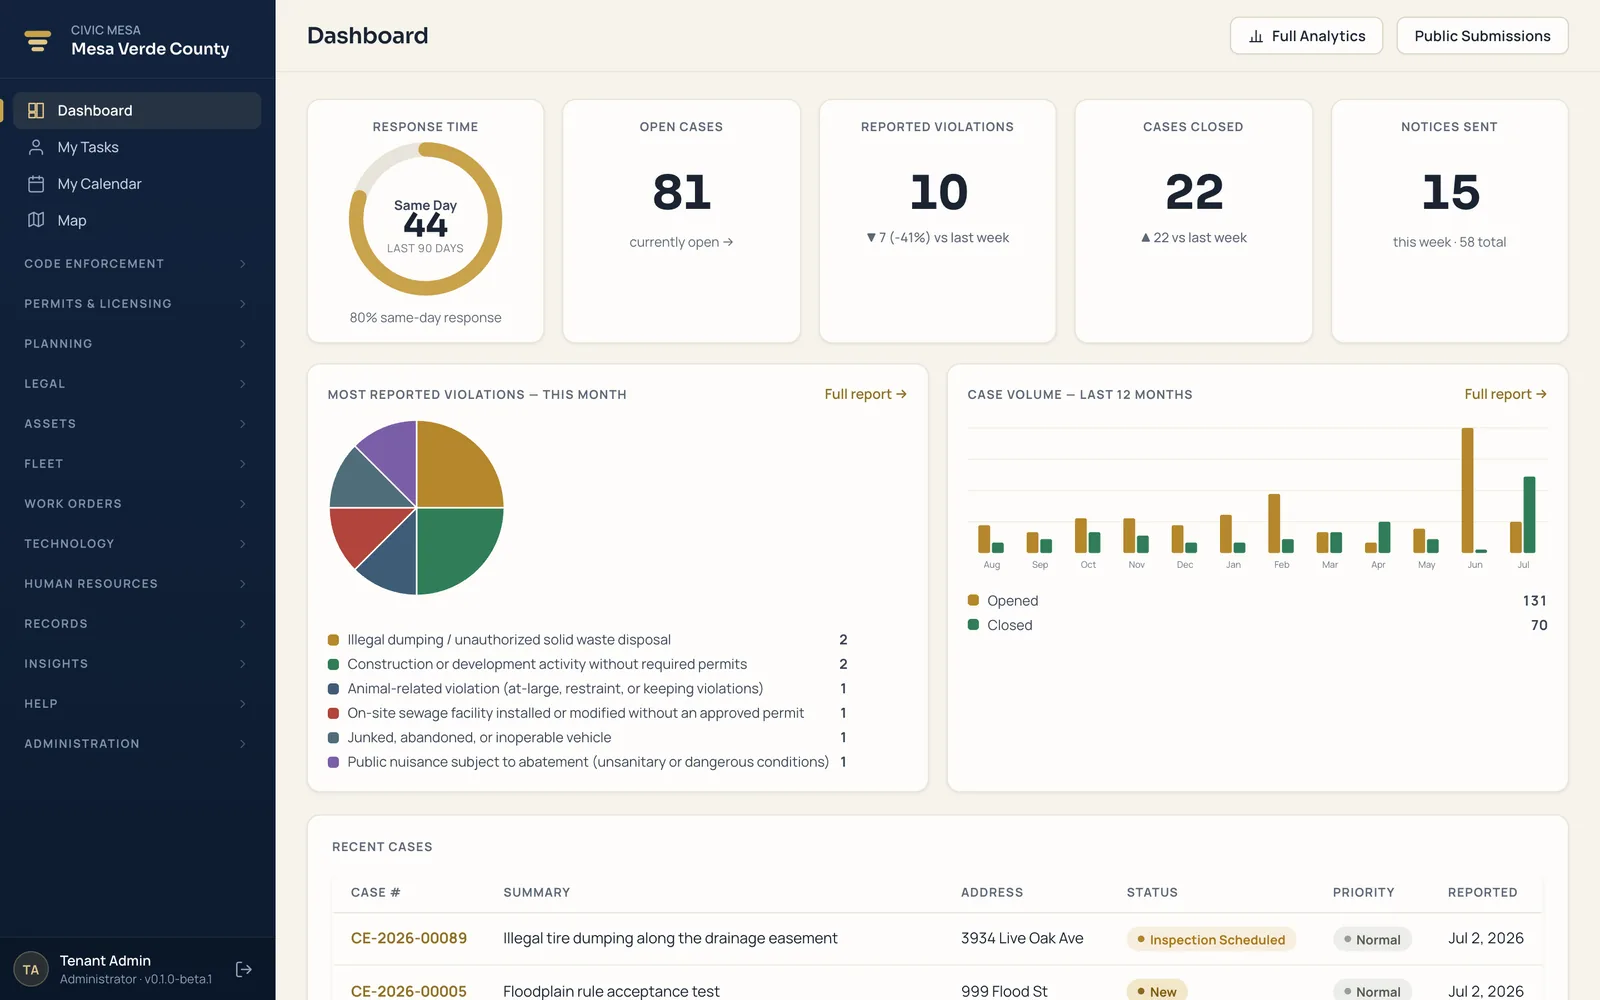
The staff dashboard is the front page of your numbers — gauges and volumes that read across every module you've enabled, so you see the day's picture the moment you log in, current as of your last action.
- At-a-glance gauges. Response time, inspections by outcome, workload by officer, and notices ready to print and serve — the whole picture in one screen.
- Twelve-month volumes. Opened versus closed by month, so you can see where work is piling up before the board asks.
- Cross-module KPIs. Backlog, cycle time, compliance rate, fee revenue, and inspections due — read across every module you've enabled, on shared data.
Right-sized for any local government — not just big counties.
Reporting & Analytics scales from a single-department office to a full metro operation. It's the same top-tier product whether you're a county reporting to a board of commissioners or a village that just needs one clean number for the monthly meeting.
Counties
Roll backlog, cycle time, and fee revenue up across every department into one board-ready dashboard, and export the rows behind any figure for the county attorney or a records request.
Cities & towns
Bring code, permits, and public-works numbers into one place so council packets and finance reconciliations pull from the same source instead of five spreadsheets.
Villages & small municipalities
A one- or two-person office gets a real dashboard instead of a hand-built report — no analyst required, and every figure exports straight to CSV for the monthly meeting.
Special districts & authorities
Health, fire, housing, and community-improvement districts track their own KPIs and year-over-year trends on the same shared data, with numbers that hold up to an audit.
A full product today. A platform when you're ready.
Buy Reporting & Analytics by itself and run your whole office's numbers on it. Add another Civic Mesa product later and its data flows straight into the same dashboards under the same umbrella — the same property, people, and map — with no migration and nothing re-keyed.
Every module you enable
Each product you turn on adds its own KPIs to the same dashboard automatically — from one data core, not a separate report — so the numbers stay in one place as you grow.
Add Code Enforcement
Backlog, compliance rate, workload by officer, and notices ready to serve read straight off your live cases — the enforcement picture, current as of your last action.
Add Permitting & Licensing
Permit cycle time, fee revenue, and expiring-soon licenses roll into the same trends and exports — so a finance reconciliation ties back to the exact record it came from.
See Reporting & Analytics on your own numbers.
Book a demo, then run a pilot on your real records, departments, and branding — import from your current vendor, dry-run first, and evaluate on your own KPIs and exports. Flat per-module pricing with unlimited users, and your data stays portable, so there's no lock-in.